


Area of circles show confirmed cumulative cases in US states on April 6, 2020. Left: actual reported cases, right: estimated cases if no anti-contagion policies had been deployed.
Estimated cumulative COVID-19 infections in the US with and without anti-contagion policies
Area of circles show confirmed cumulative cases in Italian provinces on April 6, 2020. Left: actual reported cases, right: estimated cases if no anti-contagion policies had been deployed.
Area of circles show confirmed cumulative cases in 116 Chinese cities where data is available (shaded grey) on March 5, 2020. Left: actual reported cases, right: estimated cases if no anti-contagion policies had been deployed.
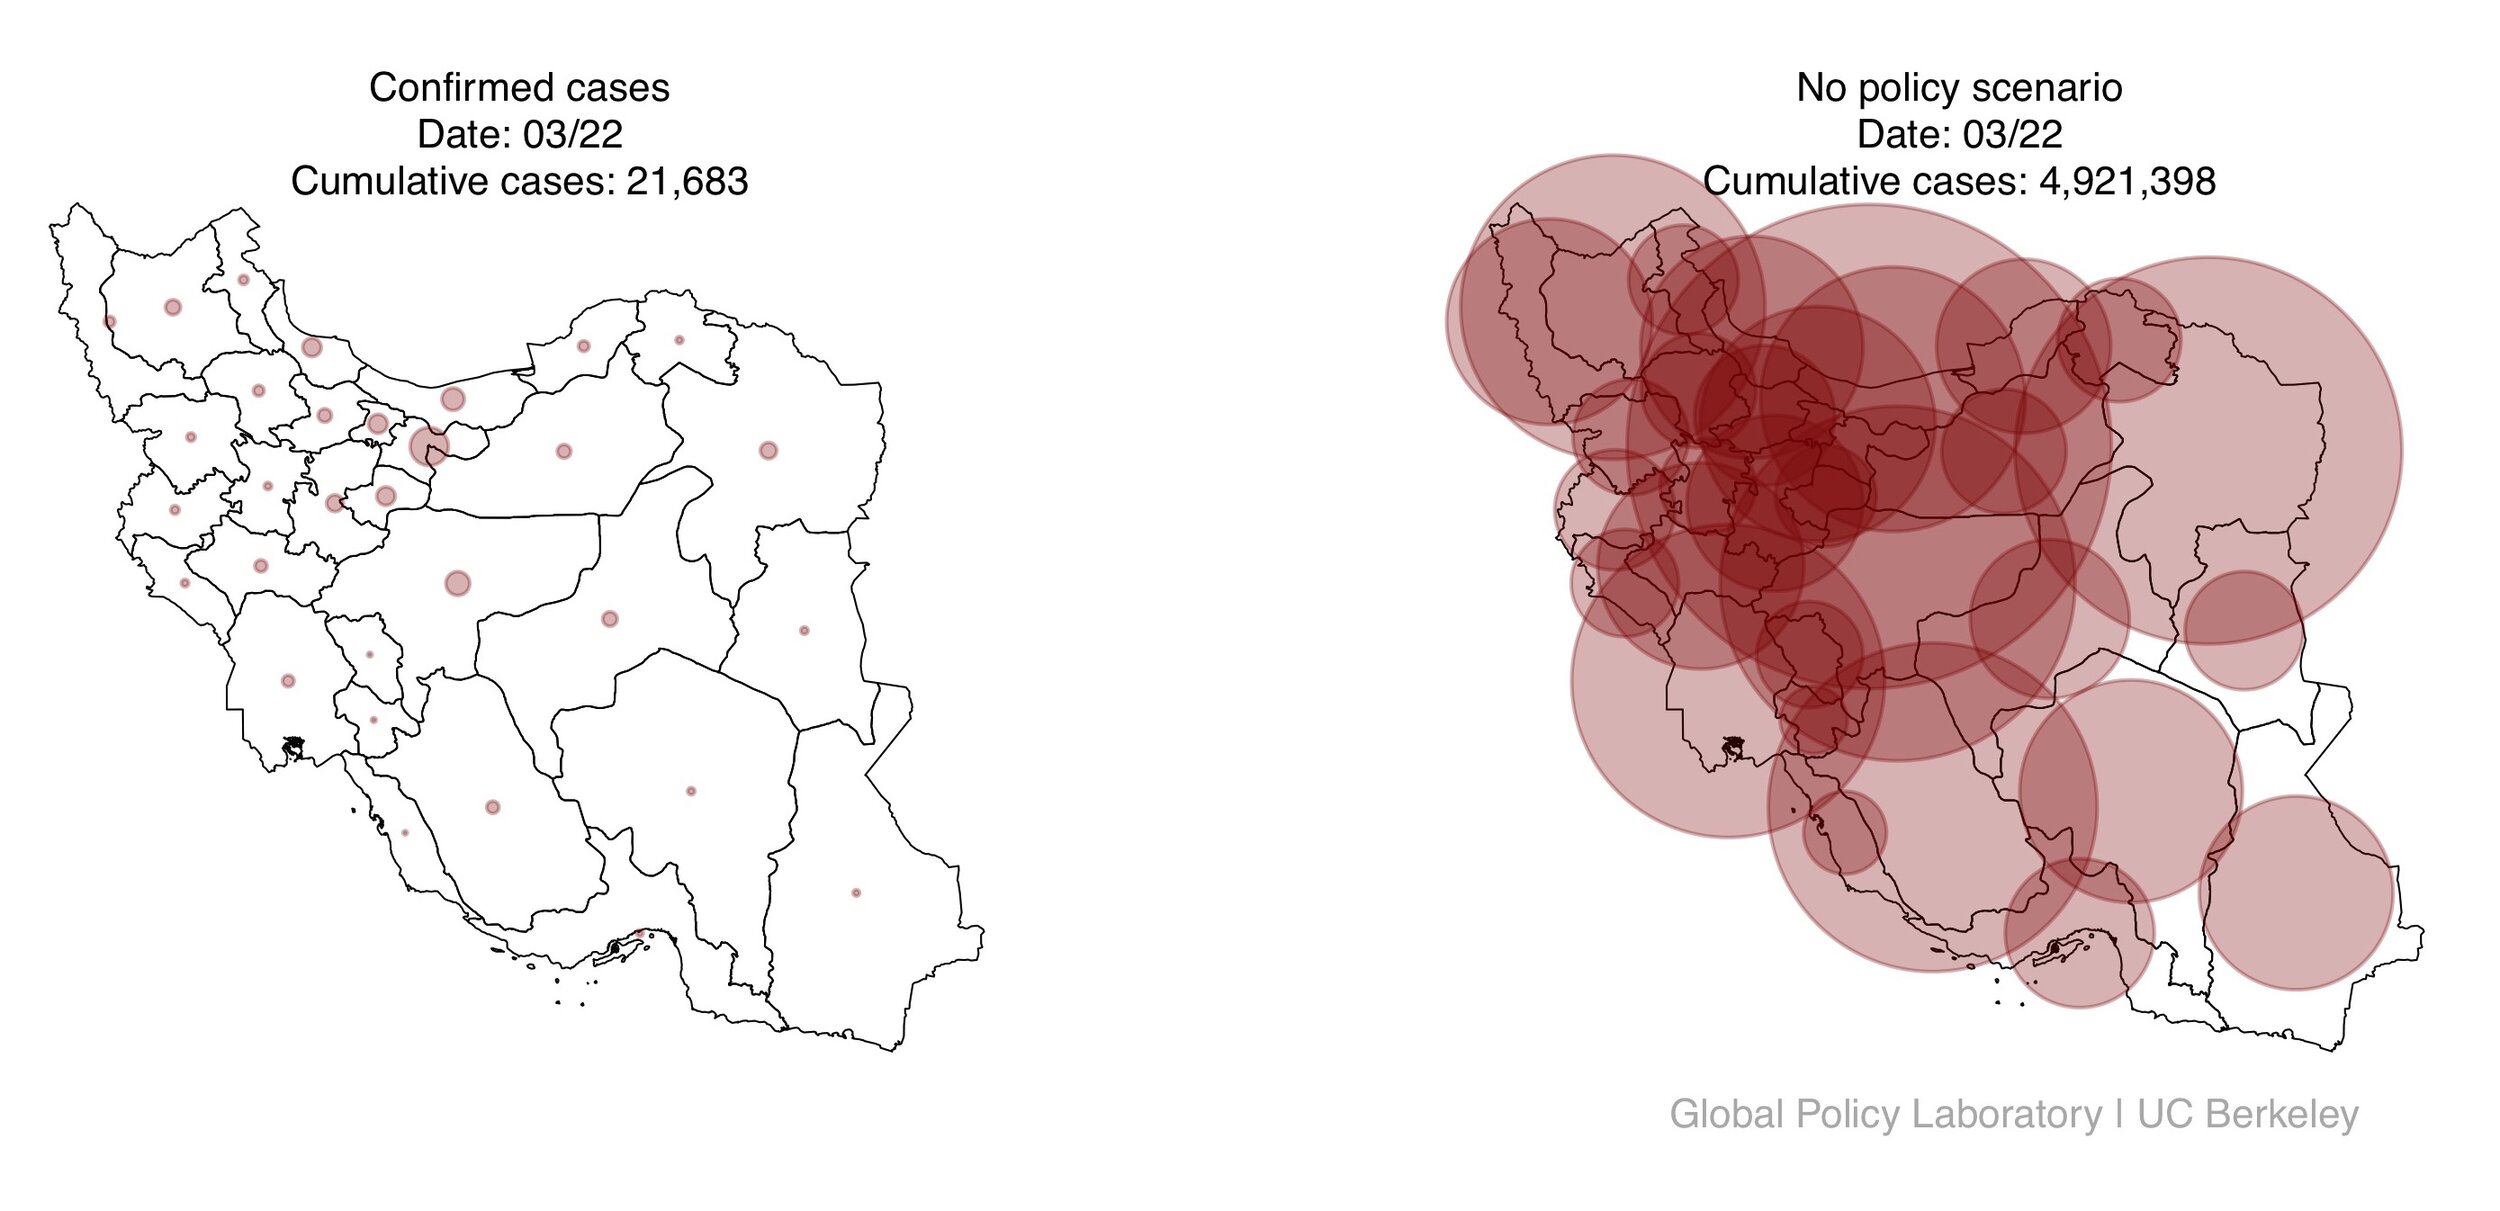
Area of circles show confirmed cumulative cases in Iranian provinces on March 22, 2020. Left: actual reported cases, right: estimated cases if no anti-contagion policies had been deployed.
Area of circles show confirmed cumulative cases in South Korean provinces on April 6, 2020. Left: actual reported cases, right: estimated cases if no anti-contagion policies had been deployed.
Estimated cumulative COVID-19 infections in South Korea with and without anti-contagion policies
Area of circles show confirmed cumulative cases in French regions on March 25, 2020. Left: actual reported cases, right: estimated cases if no anti-contagion policies had been deployed.
Estimated cumulative COVID-19 infections in France with and without anti-contagion policies
Panel A (top left): Estimates of daily COVID-19 infection growth rates in the absence of policy; Panel B (bottom left): Estimated combined effect of all policies on infection growth rates; Panel C (right): Estimated effects of individual policies or policy groups on the daily growth rate of infections, jointly estimated and ordered roughly chronologically within each country.